Creative Commons, "Pie Chart," Courtesy of Pixabay
Inequality Within Race
|
In 2010, more than 27 million children had an incarcerated parent. Only one and 57 white children have a parent incarcerated, whereas one in nine African American children had a parent incarcerated [1]. Further, according to the US Sentencing Commission, African Americans spend on average 19.1% longer sentences than a white American for the exact same crime. In the instance of crack and cocaine, crack has a higher sentencing even though they are the same drug just in different forms (crack being rock and cocaine being powder). The difference is, 85% of convicted crack users are African American, whereas the majority of convicted cocaine users are White Americans. Before 2010 the jail sentence disparity was 100:1 creating an influx of African Americans in the prison system, as they were required to serve longer sentencing than White Americans for the exact same crime. Although, in 2010 Congress passed the Fair Sentencing Act (FSA) reduced the sentence disparity from 100:1 to 18:1 for the two forms of the same drug [2]. They labelled it "scientifically unjustifiable" to have two different sentences for the same drug.
|
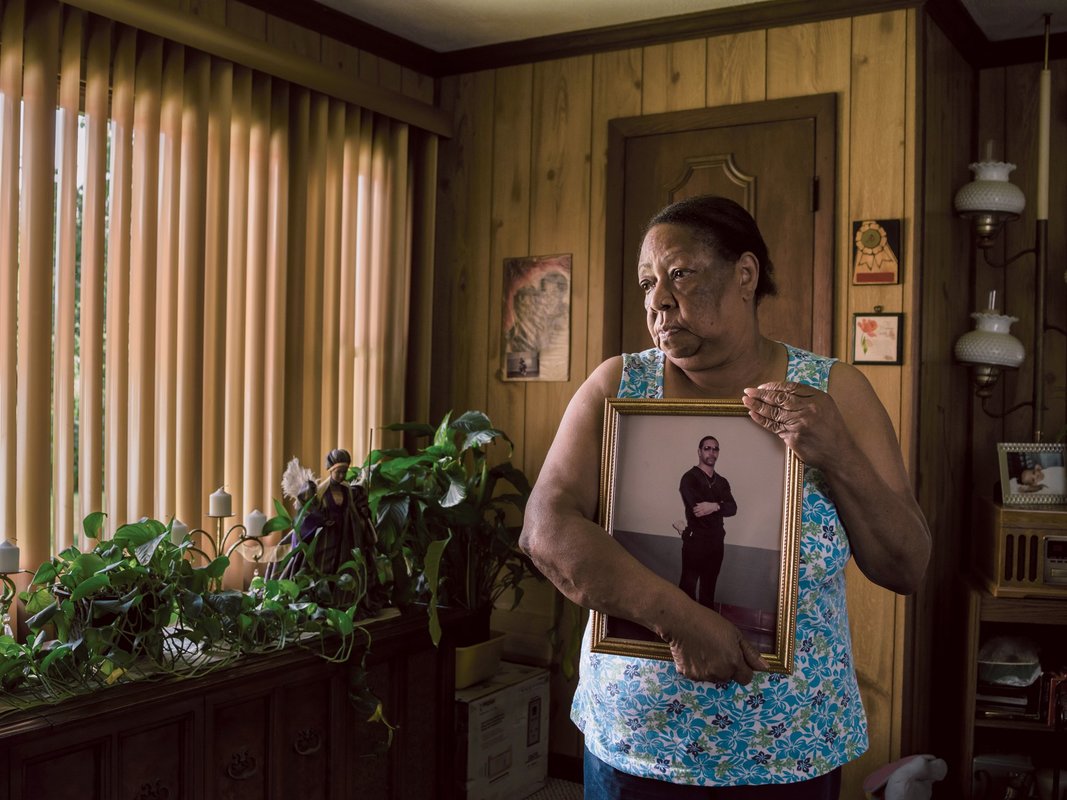
Clara Newton at her home outside Baltimore, holding a picture of her son Odell, who has been in prison for 41 years for a crime he committed when he was 16. State officials have recommended Odell for release three times since 1992, but he has not been freed. August 4, 2015. Copyrighted image used under fair use standards by Greg Kahn- Washington D.C. Photographer
|
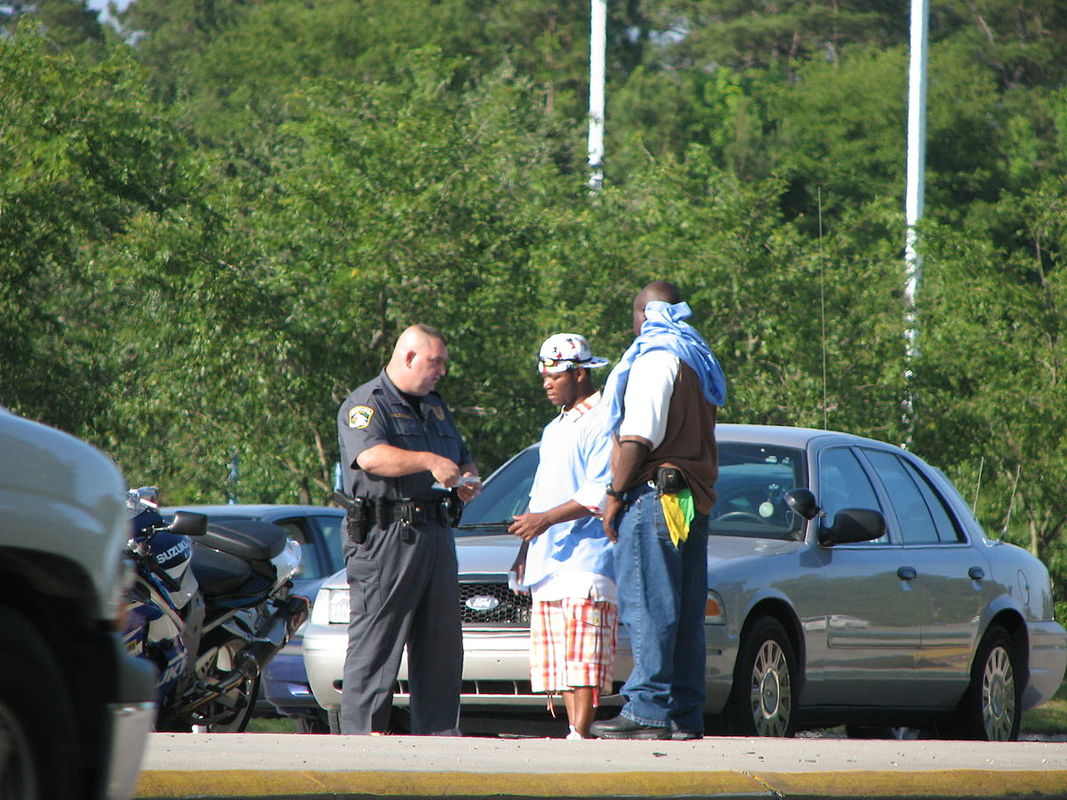
Creative Commons 2.0, "nice little bit of police harassment," Courtesy of Wikimedia Commons
|
Law enforcement officials use racial profiling when choosing who to target for law violations. This is seen immensely with African Americans, as they are targeted more often than any other race. This is shown directly within incarceration because one in eight African Americans (between ages 20-29) are in prison or jail, whereas it is only one out of fifty-nine white people [3]. This discrepancy is so large because law enforcement officials use race as a determining factor for targeting people. This is commonly seen in vehicle/driving situations where police officers more frequently decide to pull over someone who is African American rather than white in hopes to also conduct a successful drug search along with the minor traffic violation [4]. Some of these violations include not completely stopping at a stop sign or failing to use a turn signal [5].
|
|
It is easy to see the biases that accompany mass incarceration by looking at the gender and racial breakdowns of inmates. Black men are only 6.5% of the United States population, but make up 40.2% of the United States prison population. African Americans are 6x more likely to be imprisoned than white people. Black men also have a 1 in 3 chance of being imprisoned at least once in their lifetime, Latino men have a 1 in 6 chance, compared to white men who have a 1 in 17 chance [5]. Even when looking at women, Black women have a 1 in 18 chance of being imprisoned, Latina have a 1 in 45, and white women have only a 1 in 111 chance [6].
|
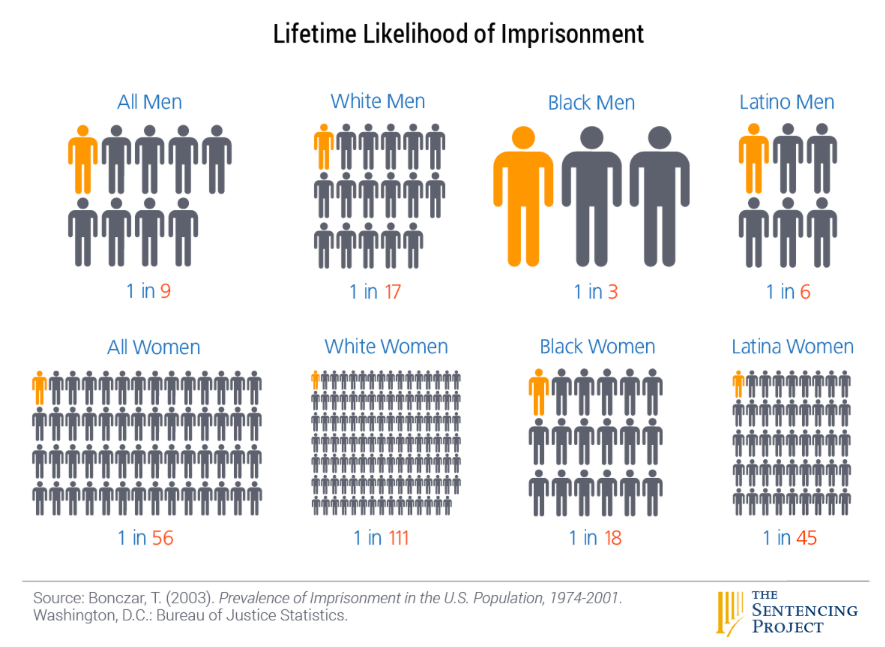
Copyrighted Image used under fair use standards, By T. Bonczar- Bureau of Justice Statistics, Courtesy of The Sentencing Project
|
Socioeconomic Inequality
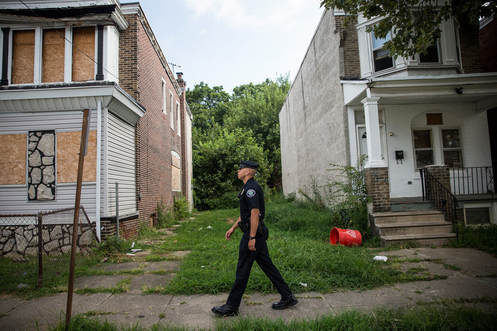
Copyrighted Image used under fair use standards, "A police officer walks in Camden, New Jersey," Courtesy of Andrew Burton, Getty Images
|
Police forces were given large incentives by the government, like cash bonuses, to capture drug criminals because the government wanted to make the War on Drugs a priority. Due to this, they began to target poor neighborhoods because of their vulnerability so that they could make easy arrests. The cycle of poverty in these areas is constantly driven due to ex-convicts having no money, low chances of getting employment from the criminal stigma, and the excessive dues they have to pay once they are released from prison [5].
|
Sources
1. University, Rutgers. “Children and Families of the Incarcerated Fact Sheet .” Rutgers University, National Resource Center on Children & Families of the Incarcerated , nrccfi.camden.rutgers.edu/files/nrccfi-fact-sheet-2014.pdf.
2. Pettit, Becky, and Bruce Western. “Mass Imprisonment and the Life Course: Race and Class Inequality in U.S. Incarceration.” American Sociological Review, vol. 69, no. 2, 2004, pp. 151–169., doi:10.1177/000312240406900201.
3. Levinson, Justin D. Implicit Racial Bias Across the Law. Cambridge University Press, 2012.
4. Knowles, John, et al. “Racial Bias in Motor Vehicle Searches: Theory and Evidence.” Journal of Political Economy, vol. 109, no. 1, Dec. 1999, pp. 1–47., doi:10.3386/w7449.
5. Alexander, M. (2012). The New Jim Crow: Mass Incarceration in the Age of Colorblindness (Revised Paperback ed.). New York, NY: The New Press.
6. Bonczar, T. (2003). Prevalence of Imprisonment in the U.S. Population, 1974-2001. Washington, D.C.: Bureau of Justice Statistics.
